The Urban Labour Market
The urban labour market refers to the interactions between workers and employers in urban areas, and is a crucial component of the economy. The urban labour market comprises two key elements: urban labour demand and urban labour supply.
Urban labour demand refers to the number of workers employers in the urban area are willing to hire at a given wage level. The quantity of labour demanded is influenced by factors such as firms’ productivity in the metropolitan area, the level of technology, and the cost of inputs like capital and raw materials.
Urban labour supply, on the other hand, refers to the number of workers who are willing and able to work in the urban area at a given wage level. The quantity of labour supplied is influenced by factors such as the size and composition of the urban population, the level of education and skills of workers, and the availability of job opportunities in other locations.
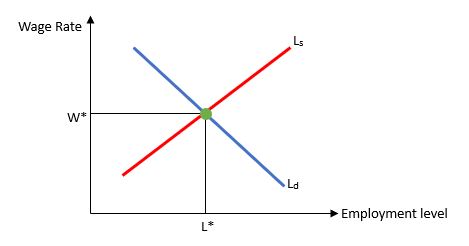
The interaction between urban labour demand and urban labour supply determines the equilibrium wage and employment levels in the urban labour market. Specifically, the equilibrium wage and employment levels are determined by the labour demand and supply curves’ intersection.
The urban labour demand curve represents the relationship between the quantity of labour demanded and the wage rate. It is downward-sloping because employers demand fewer workers as the wage rate increases due to the higher labour cost.
The urban labour supply curve represents the relationship between the quantity of labour supplied and the wage rate. It is upward-sloping because as the wage rate increases, more workers are willing to provide their work due to the higher compensation offered.
The equilibrium wage and employment levels are determined where the labour demand and supply curves intersect. At this point, the quantity of labour demanded equals the quantity of labour supplied. There is no excess demand or supply of labour.
The equations for the labour demand and labour supply curves are:
Labor demand: Ld = a – bW
Labor supply: Ls = c + dW

Ld represents the quantity of labour demanded, Ls represents the quantity of labour supplied, W represents the wage rate, and a, b, c, and d are constants that reflect the underlying factors influencing labour demand and supply.
The labour demand and supply curves can be graphed on a standard x-y coordinate system. The quantity of labour (L) is represented on the x-axis, and the wage rate (W) is described on the y-axis. The equilibrium wage and employment levels are then determined by finding the intersection of the labour demand and supply curves.
In the graph, the labour demand curve (Ld) is represented by the blue line, and the labour supply curve (Ls) is represented by the red line. The green point where the two curves intersect shows the equilibrium wage rate (W) and employment level (L). At this point, the quantity of labour demanded (L) equals the quantity of labour supplied (L), and the labour market is in equilibrium.


